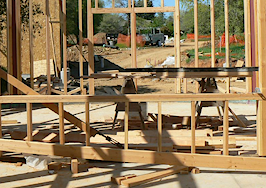
After a promising gain in March, the rate of new home construction being started in America fell back down last month. The U.S. Census Bureau and the U.S. Department of Housing and Urban Development (HUD) today released its report on April’s new residential construction starts — that is, new residential projects that have broken ground — and it found that in total, privately-owned housing starts declined 3.7 percent month-over-month (+/- 11.4 percent) to a seasonally adjusted rate of 1.28 million.
Much like we saw in February, a lack of activity in multifamily construction (multi-unit structures like townhouses and slot houses) is to blame for the month’s lackluster performance.
Here’s the break down:
Despite the 3.7 percent overall month-over-month drop, all new housing starts are up 10.5 percent (+/- 9.7 percent) year-over-year (from April 2017).
Single-family housing starts edged up barely, just 0.1 percent month-over-month (+/- 11.8 percent) to a rate of 894,000. These are usually stand-alone dwellings that many think of when they picture the typical American suburban home.
Multifamily housing starts with five or more units fell from a seasonally adjusted 428,000 in March 2018 to 374,000 in April, a 12.6 percent drop.
Overall building permits were down 1.8 percent month-over-month (+/- 1.3 percent), but were 7.7 percent above (+/- 0.9 percent) April 2017. Single-family housing permits also increased 0.9 percent (+/- 1.4 percent) to a rate of 859,000.
Lastly, privately-owned housing completions increased 2.8 percent month-over-month (+/- 10.1 percent) and 14.8 percent year-over-year (+/- 10.5 percent) to a rate of 1,257,000. Single-family completions were at a rate of 820,000 — 4 percent below (+/- 9.2 percent) March’s rate of 854,000.
Freddie Mac chief economist Sam Khater said the overall drop in new residential construction can be pinpointed to a significant drop in multifamily starts and non-existent growth in the single-family sector.
“The April decline was also driven by weakness in multifamily, which experienced a 13 percent drop in starts relative to March,” Khater said in a statement. “Single-family essentially remained flat.”
Realtor.com chief economist Danielle Hale said the small boost (+0.1 percent) is a step in the right direction, but it’s nowhere near enough to satisfy demand and cool home price growth.
“We remain significantly behind a normal level of 1.2 million starts,” Hale said in a statement. “In fact, if single-family starts continue at the strong yearly growth rate we saw in April, it will be fall 2019 before annual single-family starts break the 1 million mark consistently — which is still 17 percent lower than normal.”
“New construction is needed to boost overall home inventory and help tame price increases,” she noted. “Realtor.com listing prices are up 8 percent year-over-year in part because active listings have fallen 6 percent from last April.”

About the report
The metrics in the New Residential Construction report measure new, privately owned housing units, excluding manufactured (mobile) homes. The U.S. Census Bureau and HUD collect the data from the Building Permits Survey and from the Survey of Construction, which is partially funded by HUD.
The Building Permits Survey produces estimates of the number of permits issued for new housing units based on a mail survey of a sample of permit offices. The Survey of Construction produces monthly estimates of housing starts and completions; Census Bureau field representatives sample individual permits within a sample of permit offices and then interview the builders or owners who took out the sampled permits to obtain start and completion date, as well as sale dates and characteristics, such as size and number of bedrooms.
Field representatives also drive roads looking for new residential construction activity in land areas where building permits are not required.


