Opendoor, the real estate startup that purchases homes directly from sellers, leads the pack of a new breed of real estate tech companies. It continues to innovate and improve the experience of buying and selling a home, and as the analysis below shows, the “iBuyer” is making significant improvements to its business model as it continues to grow.
Here are four telling numbers related to Opendoor’s current operations.
150%: Growth in homes sold
I believe Opendoor’s ultimate metric of success is how many homes it sells. More than just buying homes (which anyone can do with enough money), the successful completion of Opendoor’s business model requires it to re-list and sell the homes it buys.
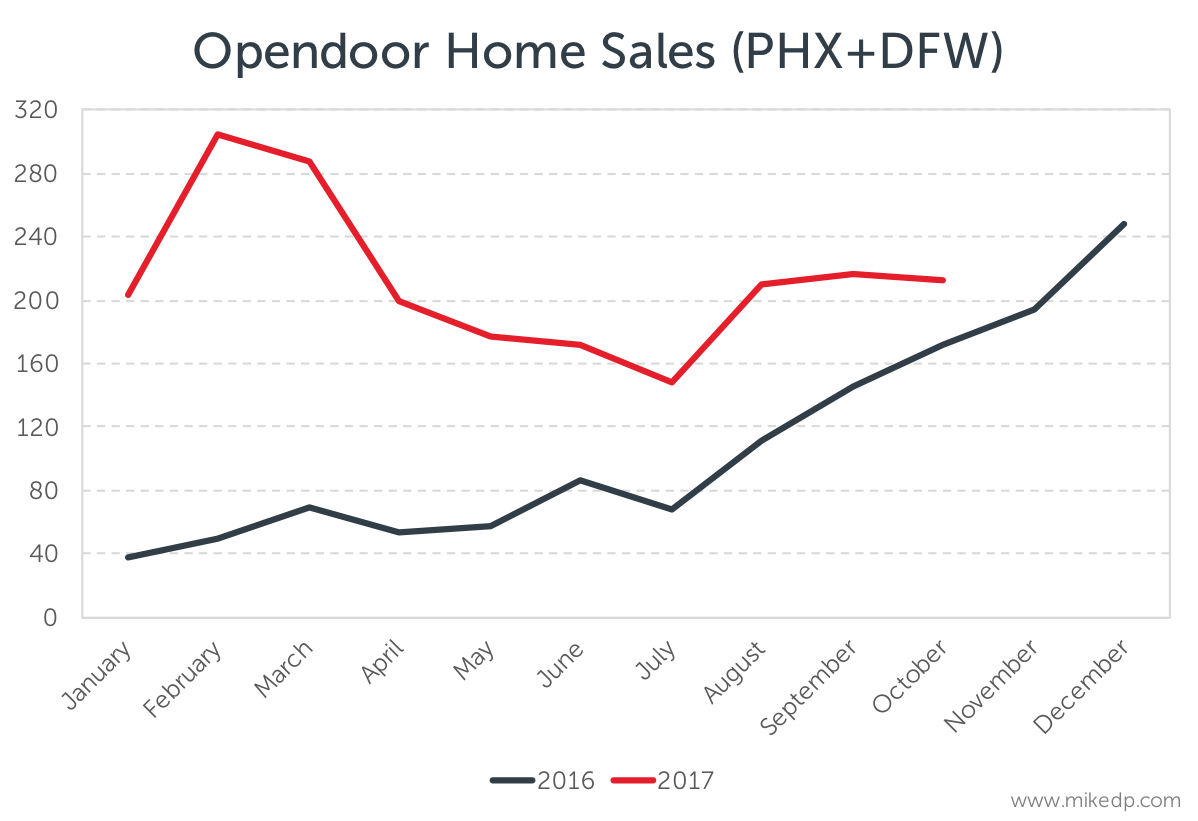
So it should come as no surprise that the first key number — 150 percent — is the growth in homes Opendoor has sold in 2017 compared to the same period last year in its two biggest markets, Phoenix and Dallas.
The year-over-year growth is driven by Dallas, which came online in September of 2016. Entry into new markets will drive Opendoor’s overall growth. Over the same time period, Phoenix experienced a 55 percent increase in home sales.
The more recent growth in home sales has been driven by the Phoenix market, where Opendoor is selling a median average of 130 homes per month over the past three months, compared to 90 homes per month for the preceding three months.
After a big bump in Q1 of 2017, home sales in Phoenix are tracking in-line with last year.
However, there is a notable uptick in the number of homes purchased by Opendoor in recent months. Given that, we can expect a corresponding uptick in sales for the rest of the year and into early 2018.
13: Opendoor’s prep days
This is the median average number of “prep days” between when Opendoor buys a home and subsequently lists it for sale. This is based on 50 recent transactions in Phoenix and Atlanta (where Opendoor recently launched).
Opendoor prep days
Impressively, this number is down from a median average of 20 days when I last did an analysis in December of 2016. That’s a 35 percent improvement! To quote that earlier analysis, “…given that Opendoor generally borrows 90 percent of the purchase price and is servicing that debt, time is money!”
That earlier analysis also predicted that a “battle-tested and efficient flip process” was one of three sources of competitive advantage for Opendoor. This improvement reflects strides made in Opendoor’s operational efficiency. It is clearly standardizing its operations and learning from past success and failures on big and small levels, to truly become a home flipping machine.
And it’s not just in Phoenix, Opendoor’s first market. It’s newest market, Atlanta, is on track just as impressively. Looking at 20 transactions shows a median average of 11 prep days. That’s a great start.
Most importantly, this shows that Opendoor’s growing operational efficiency is a transferable competitive advantage between markets. This is a critical ingredient for national expansion.
41: Competitor’s prep days
This is the median average number of prep days for Opendoor’s top competitor in the Phoenix market, OfferPad. This is based on a selection of transactions in July, August, and September.
It clearly shows that OfferPad is holding homes longer than its competitor — over three times as long!
OfferPad prep days
In a world where time is money, this represents a significant business model and financial disadvantage for OfferPad. The longer it holds homes, the higher its holding costs.
It’s not clear what’s driving this number. Could OfferPad be spending more time and money fixing up houses before flipping them?
Regardless of the answer, the comparison of prep times between Opendoor and OfferPad illustrates stark differences in their respective business models. Opendoor aims to flip houses as quickly as possible with a super efficient process. OfferPad either has a different model, or is still working on optimizing its operations.
7.4%: Gross margin
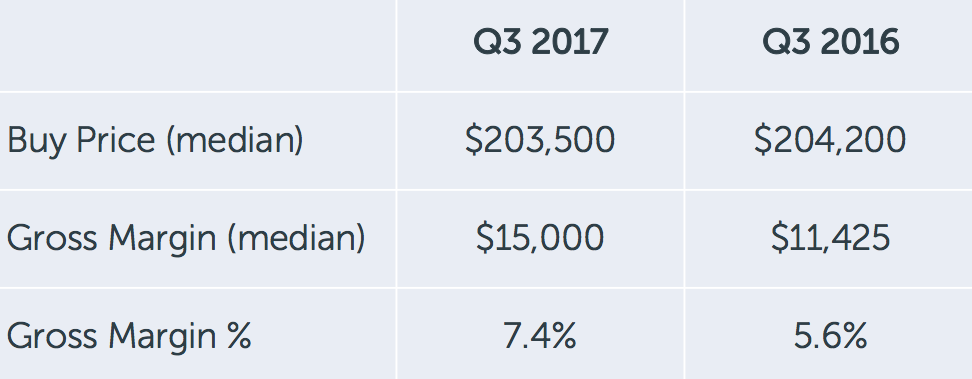
All businesses need to make money, and Opendoor is no exception. Outside of charging homeowners a fee for its services, the second way Opendoor makes money is the difference between what it buys and sells a home for. This difference is the gross margin, and in Q3 of 2017, Opendoor’s gross margin in Phoenix was 7.4 percent.
Gross margin is a top line number (hence “gross” and not “net”), meaning it does not include the numerous costs associated with holding, repairing, and reselling a house.
What’s notable about this number is that it’s up considerably over the past year. My previous analysis in December 2016 showed a gross margin of 5.5 percent, and a comparison to Q3 2016 shows a gross margin of 5.6 percent.
This data is based on all publicly recorded transactions, so it’s not just a selection or a sample.
So Opendoor has managed to increase its gross profit on each home it sells by about 30 percent. We can speculate that this is in line with its recent strategy of lowering the fees it charges to homeowners. If it can make a bit more on each home and charge homeowners a bit less, it all evens out in the end.
Final thoughts
Working through this analysis highlighted a few key takeaways.
First off, Atlanta is off to a good start. The average number of prep days is strong and the gross margin is in-line with the more mature Phoenix market. It’s still early days, but this shows that Opendoor is able to transfer its honed operational efficiency to new markets, which is a requirement if it’s going national.
Secondly, Opendoor won’t achieve its goal of being in 10 markets by the end of 2017. Expansion is slower than originally thought. With over 100 employees in Phoenix alone, perhaps the Opendoor model is more time consuming and resource intensive than originally thought?
Lastly, and I believe most importantly, Opendoor continues to grow. The customer proposition is resonating with consumers in increasing numbers. The business model is being refined. And Opendoor is learning as it expands into new markets.
This new model of buying and selling homes is not going away. The entire industry can learn from the likes of Opendoor and the growing number of competitors that are popping up. Consumers are being increasingly drawn to new models that improve the customer experience of buying and selling a home.
A note on data: this analysis is based on MLS records, listings from Opendoor’s web site, the Maricopa City Assessor’s public property records, public records sourced from Redfin, and The Cromford Report, a specialist web-site monitoring the Greater Phoenix housing market. If you’re researching Opendoor and on the hunt for data, check out the iBuyer Analysis Pack.
Mike DelPrete is a strategic adviser and global expert in real estate tech. Connect with him on LinkedIn.


