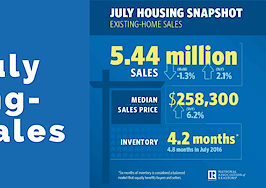
- August existing-home sales declined 1.3 percent to a seasonally adjusted annual rate (SAAR) of 5.44 million -- down from 5.51 million in June.
Existing-home sales have continued to deteriorate in the face of a persistent housing shortage, quickly rising home prices and added stress due to Hurricanes Harvey and Irma.
The National Association of Realtors’ (NAR) existing-home sales declined 1.7 percent to a seasonally adjusted annual rate (SAAR) of 5.35 million in August — down from 5.44 million in July.
This month’s sales pace is 0.2 percentage points above August 2016 and is the lowest SAAR sales pace seen in a year.

Low inventory continues to weigh on market
The median existing-home price for all housing types in August rose 5.6 percentage points to $253,500, which marks the 66th consecutive month of year-over-year gains.
Total housing inventory dropped 2.1 percentage points month-over-month to 1.88 million homes for sale. Year-over-year inventory declined 6.5 percentage points and is in its 27th consecutive month of year-over-year declines. Unsold inventory is at a 4.2-month supply, a 4.5 percent year-over-year decline.
NAR Chief Economist Lawrence Yun says the month’s existing-home sales decline is, once again, due to low inventory and rocketing home prices.
“Steady employment gains, slowly rising incomes and lower mortgage rates generated sustained buyer interest all summer long, but unfortunately, not more home sales,” Yun said.
“What’s ailing the housing market and continues to weigh on overall sales is the inadequate levels of available inventory and the upward pressure it’s putting on prices in several parts of the country. Sales have been unable to break out because there are simply not enough homes for sale.”
Furthermore, Yun says current housing market conditions are keeping would-be buyers at bay. The share of first-time buyers dropped 2 percentage points to 31 percent — the lowest rate since August 2016.
“Market conditions continue to be stressful and challenging for both prospective first-time buyers and homeowners looking to trade up,” added Yun.
“The ongoing rise in home prices is straining the budgets of some of these would-be buyers, and what is available for sale is moving off the market quickly because supply remains minimal in the lower- and mid-price ranges.”
Lastly, Yun says Hurricanes Harvey and Irma have temporarily slowed activity in the South, but he expects the region to recover beginning in 2018.
Distressed sales, which include foreclosures and short sales, were at 4 percent — a 1 percentage point month-over-month and year-over-year decrease. Three percent of August sales were foreclosures, and 1 percent were short sales.
Single-family home sales were at a SAAR of 4.74 million — a 2.1 percentage point month-over-month decrease and a 0.4 percentage point year-over-year increase. The sales price for single-family homes increased by 5.6 percentage points to $255,500.
Existing condominium and co-op sales rose 1.7 percentage points to a SAAR of 610,000 units, 1.6 percentage points lower than a year ago. The median existing condo price in August was $237,600 — up 5.4 percentage points from 2016.ow did buying patterns vary across the country?
- In the Northeast, existing-home sales rose 10.8 percent to an annual rate of 720,000, up 1.4 percent from a year ago.
Median price: $289,500, a 5.6 percent year-over-year increase. - In the Midwest, existing-home sales increased 2.4 percent to an annual rate of 1.28 million.
Median price: $200,500, a 5.0 percent year-over-year increase. - In the South, existing-home sales decreased 5.7 percent to an annual rate of 2.15 million.
Median price: $220,400, a 5.4 percent year-over-year increase. - In the West, existing-home sales dipped 4.8 percent to an annual rate of 1.20 million.
Median price: $374,400, a 7.7 percent year-over-year increase.
Existing-home sales are based on transaction closings from MLSs and include single-family homes, town homes, condominiums and co-ops.
Seasonally adjusted annual rates are used in reporting monthly data to help accommodate for seasonal variation; the annual rate for any given month represents what the total number of actual sales for a year would be if the pace for that month were maintained for a whole year.


