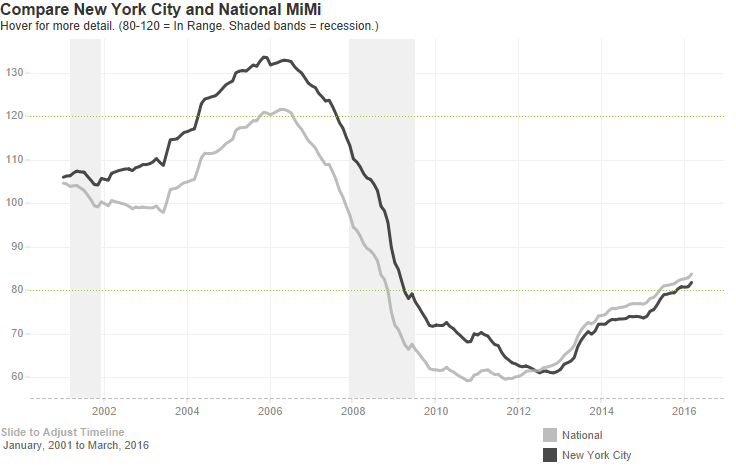
- The national MiMi reached a healthy score of 85 in June, up 5.76 percent year-over-year.
- New York City’s MiMi in June is on the lower end of the healthy range, at 83.9.
- NYC scored low in the categories of payment-to-income and current on mortgage.
Freddie Mac released its latest Multi-Indicator Market Index (MiMi) based on June housing market activity. MiMi numerically details national, state and metro-level market activity to illustrate market stability and instability across the nation.
On a national level, MiMi falls in the healthy range of 85 in June. This is a .08 percent rise from May and a 1.37 percent jump over the previous three months. Annually, the national MiMi is up 5.76 percent.
The Freddie Mac MiMi is calculated using four key indicators: purchase applications, payment-to-income ratios, mortgage health and employment rates. Markets in-range are scored between 80 and 120, while numbers below 80 are considered weak. Scores above 120 are elevated.
In national highlights, South Carolina and the Georgia metros of Atlanta and Augusta reached historic activity levels in June.
New York City’s MiMi in June is on the lower end of the healthy range, at 83.9 — up 0.72 percent from the month prior. Over a three-month period, NYC’s MiMi increased 2.44 percent. Over the course of a year, it boosted 7.43 percent.
NYC scored “healthy” for purchase applications (82.2) and employment (116.2). But payment-to-income scored a low 75.9, which is down 0.26 percent month-over-month. Current-on-mortgage for NYC scored an even lower 61.2, which fell 2.17 percent from May.


