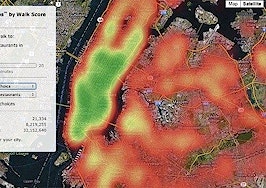
Walk Score is now leveraging social media and crime data to paint more vivid portraits of communities on its neighborhood pages.
Social Neighborhood Tags displays words or phrases that appear most frequently in tweets sent from a particular neighborhood, and represents the first “geospatial analysis of tweets” offered on a real estate site, said Walk Score Chief Technology Officer Matt Lerner.
Walk Score’s new Crime Reports add a layer of sophistication to crime data presentation by controlling for population in rating a neighborhood’s crime level, Lerner said.
The features are intended to enrich Walk Score’s neighborhood pages, which the company recently revamped in a bid to go beyond merely providing neighborhood metrics, like its signature Walk Score, to also capture the “qualitative and aesthetic qualities of neighborhoods,” Lerner said.
In addition to Social Neighborhood Tags and Crime Reports, the new neighborhood pages feature more media than the site’s previous neighborhood pages, provide generous exposure to “neighborhood guides,” and integrate the site’s walkability, transportation and choice metrics.
An area’s Social Neighborhood Tags represent the words and phrases that are most commonly tweeted from a particular neighborhood, providing a window into the gossip, amenities and characteristics of a particular neighborhood. Lerner said the site offers Social Neighborhood Tags for more than 3,000 neighborhoods in almost 200 cities.
“They tell you what’s unique or interesting in that neighborhood, whether the neighborhood is about eating or partying, or nightlife or art,” he said.
In integrating crime statistics into its site, Walk Score is hardly breaking new ground. But Lerner said it is taking the presentation of crime data to a more sophisticated level that makes it more useful and less likely to mislead.
As Lerner explained, a crime data map is often “basically just a population map.”
“It just shows you that where there are more people, there are more crimes,” he added.
But Walk Score’s Crime Reports uses a methodology that determines the “per capita odds of actually being impacted by a crime,” partly by taking into consideration the number of people who work in a neighborhood in addition to the number of people who live in it.
With the tool, users may compare a neighborhood’s true crime level to the average level of that neighborhood’s city.
In Chicago, for example, Walk Score reports that Sheridan Park “has less violent crime and less property crime per person than the Chicago average.”
“It’s the first crime statistic on a real estate site that provides an apples-to-apples comparison,” Lerner said.


